Understanding the Use Case View
Each use case page gives you everything you need to understand the task, the data and the competition before you join. Explore active public use cases or check out exemplary template use cases. You can access public or template use cases even without an invitation.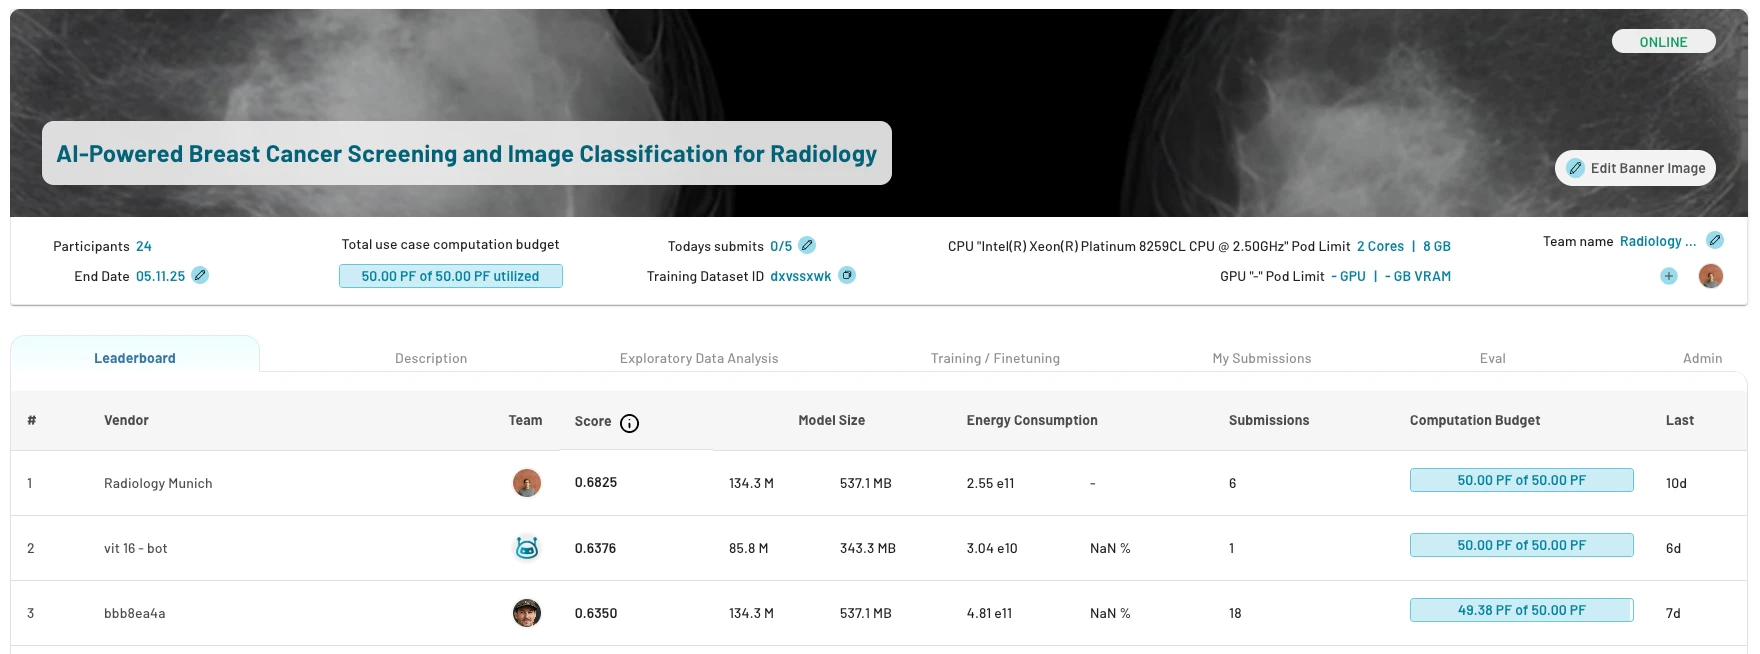
1. Leaderboard
The leaderboard ranks the teams by their best performing model. After submitting an experiment, the model gets evaluated on the test dataset or a dedicated evaluation dataset and will appear on the leaderboard. It includes:- model size in number of parameters and bytes
- energy consumption absolute and relative to other users in (FLOPs / Rel %)
- number of submissions per team
2. Description
The description tab covers:- goal, problem statement and background
- evaluation metrics
- rules and guidelines specific to this use case
3. Exploratory Data Analysis
Explore dataset details in the EDA tab. It is provided by the use case owner and should include everything needed to train and optimize models:- data format e.g. image shape
- dataset statistics e.g. distributions, number of samples, correlations
- target statistics e.g. class distribution
- description, source and context
- representative samples like images or text snippets
- labeling process
- test dataset information
4. Training / Finetuning
View your model training experiments and those of your team members. If no trainings have yet been started and the tab is still empty, look at template use case experiments.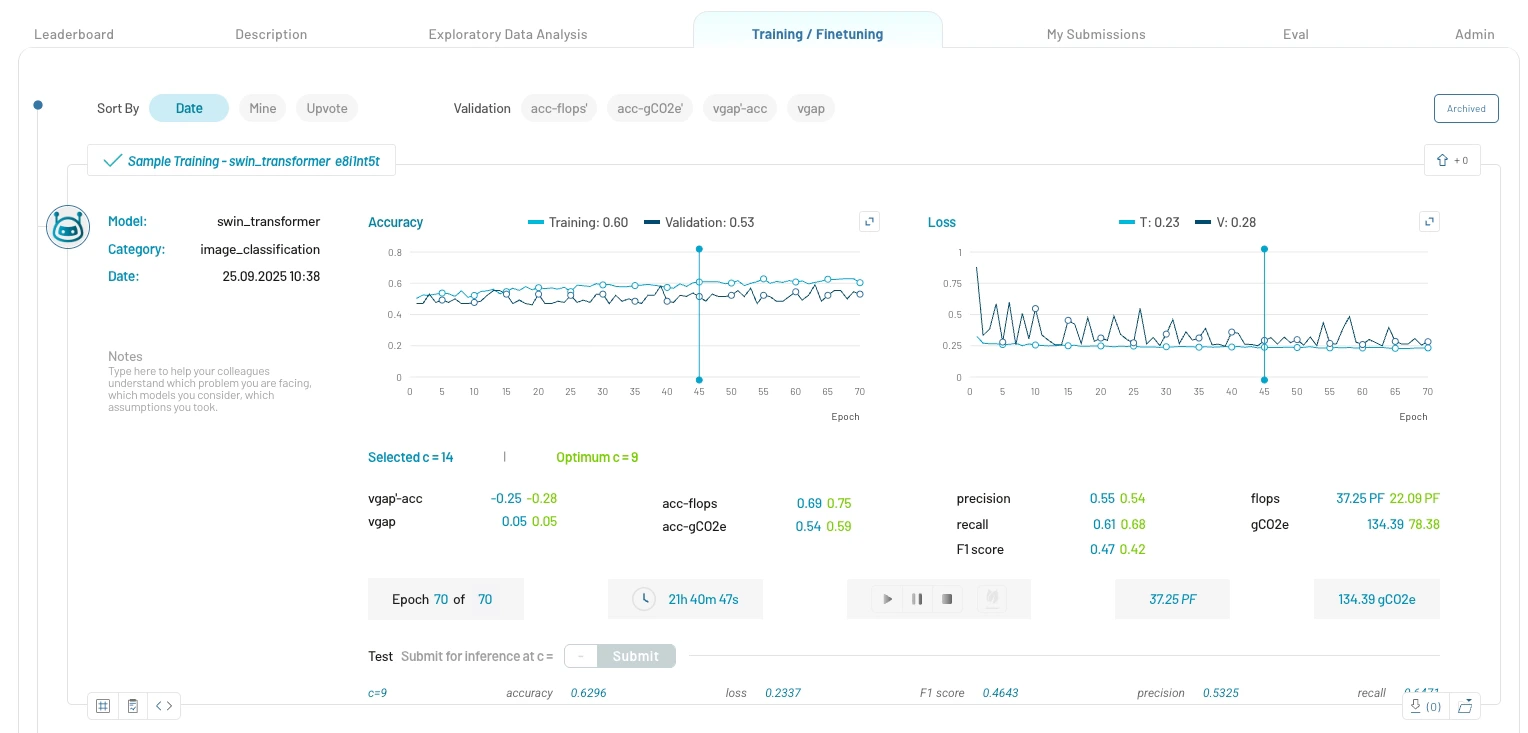
Training Details:
- Model Information: Experiment title, model name, supported training categories and experiment notes
- Performance Metrics: Accuracy, F1 score, precision, recall, etc.
- Learning Curves: Performance and loss learning curves
- Training Time: Training duration and estimated remaining time
- Resource Usage: Peta FLOPS (PFLOPS) and grams of CO2 equivalent (gCO2e) emissions utilized
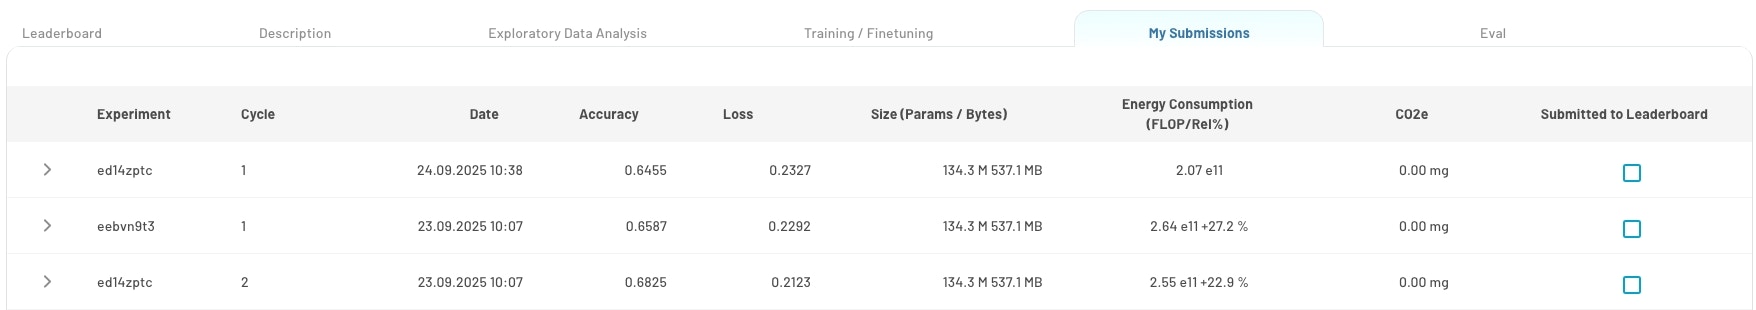
5. My Submissions
This tab displays all the experiments that were submitted for inference on the test dataset. Track and manage your model submissions:- view all submitted models of your team
- monitor submission status and results
6. Evaluation
The tab shows the selected evaluation metric with an explanation and formula on the left and an implementation code snippet on the right.Next Steps
Learn how to join a use case and get started with a model training.Need Help?
- Email us at [email protected]