The Leaderboard
Vendors are ranked by the score of their best performing model. Scores are calculated using the evaluation metric you selected when defining the use case (e.g. Accuracy, F1, mAP).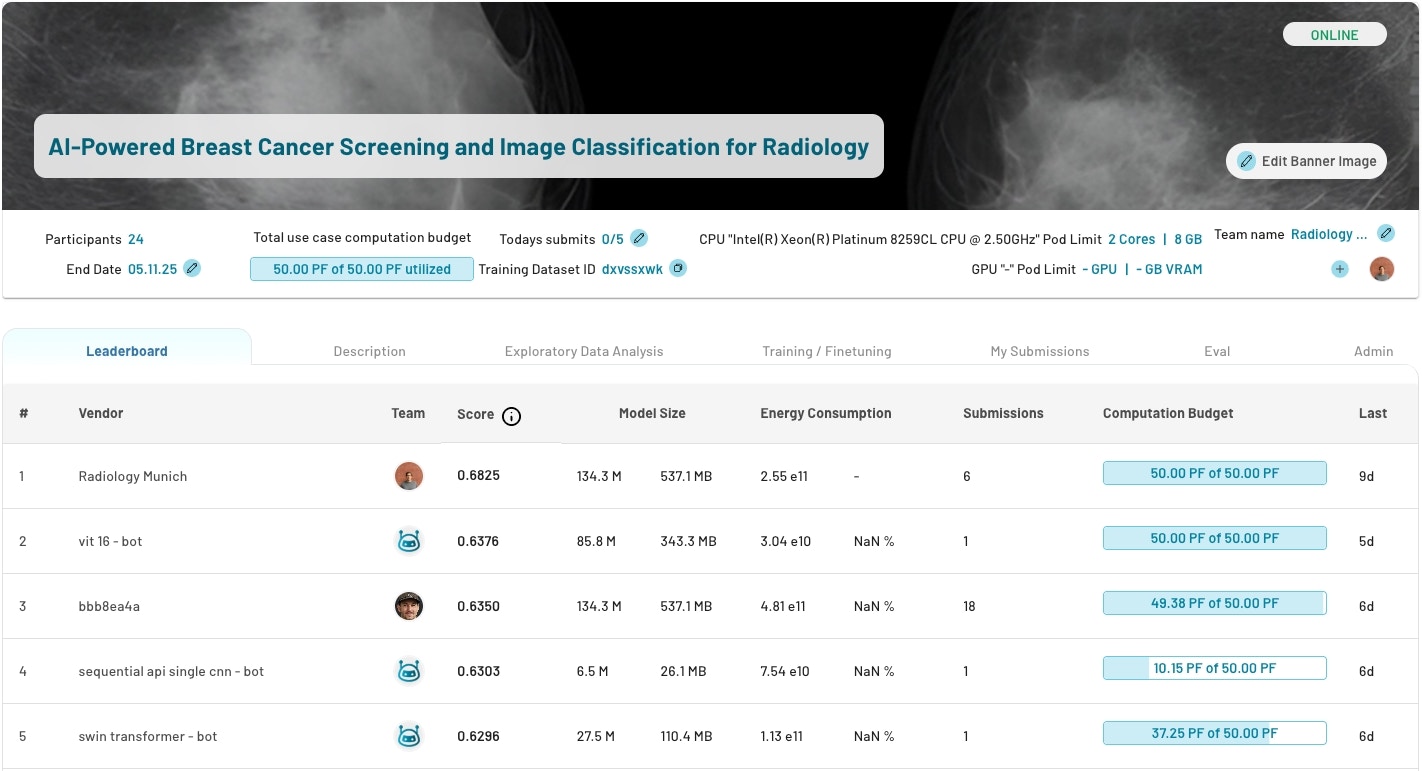
Leaderboard Columns
Actions You Can Take
From the use case view, you can:- Compare models — Use the leaderboard to identify the best performing and most efficient models side by side.
- Stop or adjust training — Reduce or revoke a team’s remaining compute budget to control costs or end a round of evaluation.
- Contact participants — Reach out to vendors or researchers directly to discuss results, request further iterations, or negotiate next steps.
- Select a winner — Once evaluation is complete, choose the best model based on score, model size, and resource efficiency.
Supported Evaluation Metrics
Scores on the leaderboard are calculated using the metric you selected when defining the use case. See the full list of supported metrics per data type and task.Next Steps
- Browse ready-made examples: Templates
Need Help?
- Email us at [email protected]