| Accuracy | Proportion of predictions that exactly match the ground truth. Can be misleading on imbalanced datasets. | Higher is better |
| Precision | Measures the proportion of predicted positives that are actually positive. Important when false positives are costly. | Higher is better |
| Recall | Measures the proportion of actual positives correctly identified. Important when missing a positive instance is costly. | Higher is better |
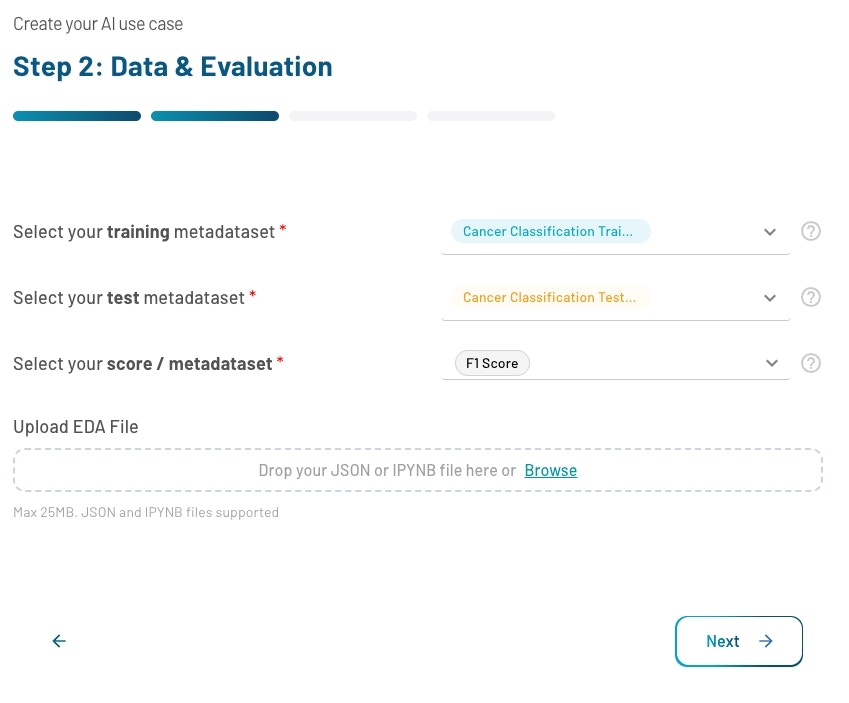
| F1 Score | Balances precision and recall into a single metric. Especially useful for imbalanced datasets. | Higher is better |
| Loss | Quantifies the error between predicted outputs and actual values. A core metric used during training and optimization. | Lower is better |
| Log Loss | Measures how well a model predicts probability estimates for each class. Penalizes overconfident incorrect predictions. | Lower is better |
| AUC | Measures ability to distinguish between positive and negative classes across all classification thresholds. | Higher is better |
| AUC-ROC | Measures ability to distinguish between classes across all thresholds, independent of any single decision threshold. | Higher is better |
| AUC-PR | Measures precision-recall balance across different thresholds. Especially useful for highly imbalanced datasets. | Higher is better |
| Balanced Accuracy | Averages recall across all classes, ensuring each class contributes equally regardless of frequency. | Higher is better |
| Specificity (True Negative Rate) | Measures the proportion of actual negatives correctly identified. Important when false positives must be minimized. | Higher is better |
| NPV (Negative Predictive Value) | Measures the proportion of predicted negatives that are actually negative. Important when confirming absence matters. | Higher is better |
| F-beta Score (beta = 0.5) | Balances precision and recall with more emphasis on precision. Suitable when false positives are more costly. | Higher is better |
| F-beta Score (beta = 2) | Balances precision and recall with more emphasis on recall. Suitable when missing positive instances is more costly. | Higher is better |
| Hamming Loss | Measures the fraction of labels incorrectly predicted. Commonly used in multi-label classification tasks. | Lower is better |
| Jaccard Score | Measures similarity between predicted and ground truth labels by comparing their intersection to their union. | Higher is better |
| Cohen’s Kappa | Measures agreement between predicted and ground truth labels while accounting for chance agreement. | Higher is better |
| Matthews Correlation Coefficient (MCC) | Classification quality using all parts of the confusion matrix. Balanced even with imbalanced classes. Ranges from -1 to 1. | Higher is better |
| Quadratic Weighted Kappa (QWK) | Measures agreement between predicted and ground truth labels, penalizing larger disagreements more heavily. | Higher is better |
| Brier Score | Mean squared difference between predicted probabilities and actual outcomes. | Lower is better |
| Gini Coefficient | Measures discriminatory power between positive and negative classes. Closely related to AUC-ROC. | Higher is better |
| Normalized Gini | Scales the Gini Coefficient relative to a perfect model, enabling fair comparison across datasets. Ranges from -1 to 1. | Higher is better |