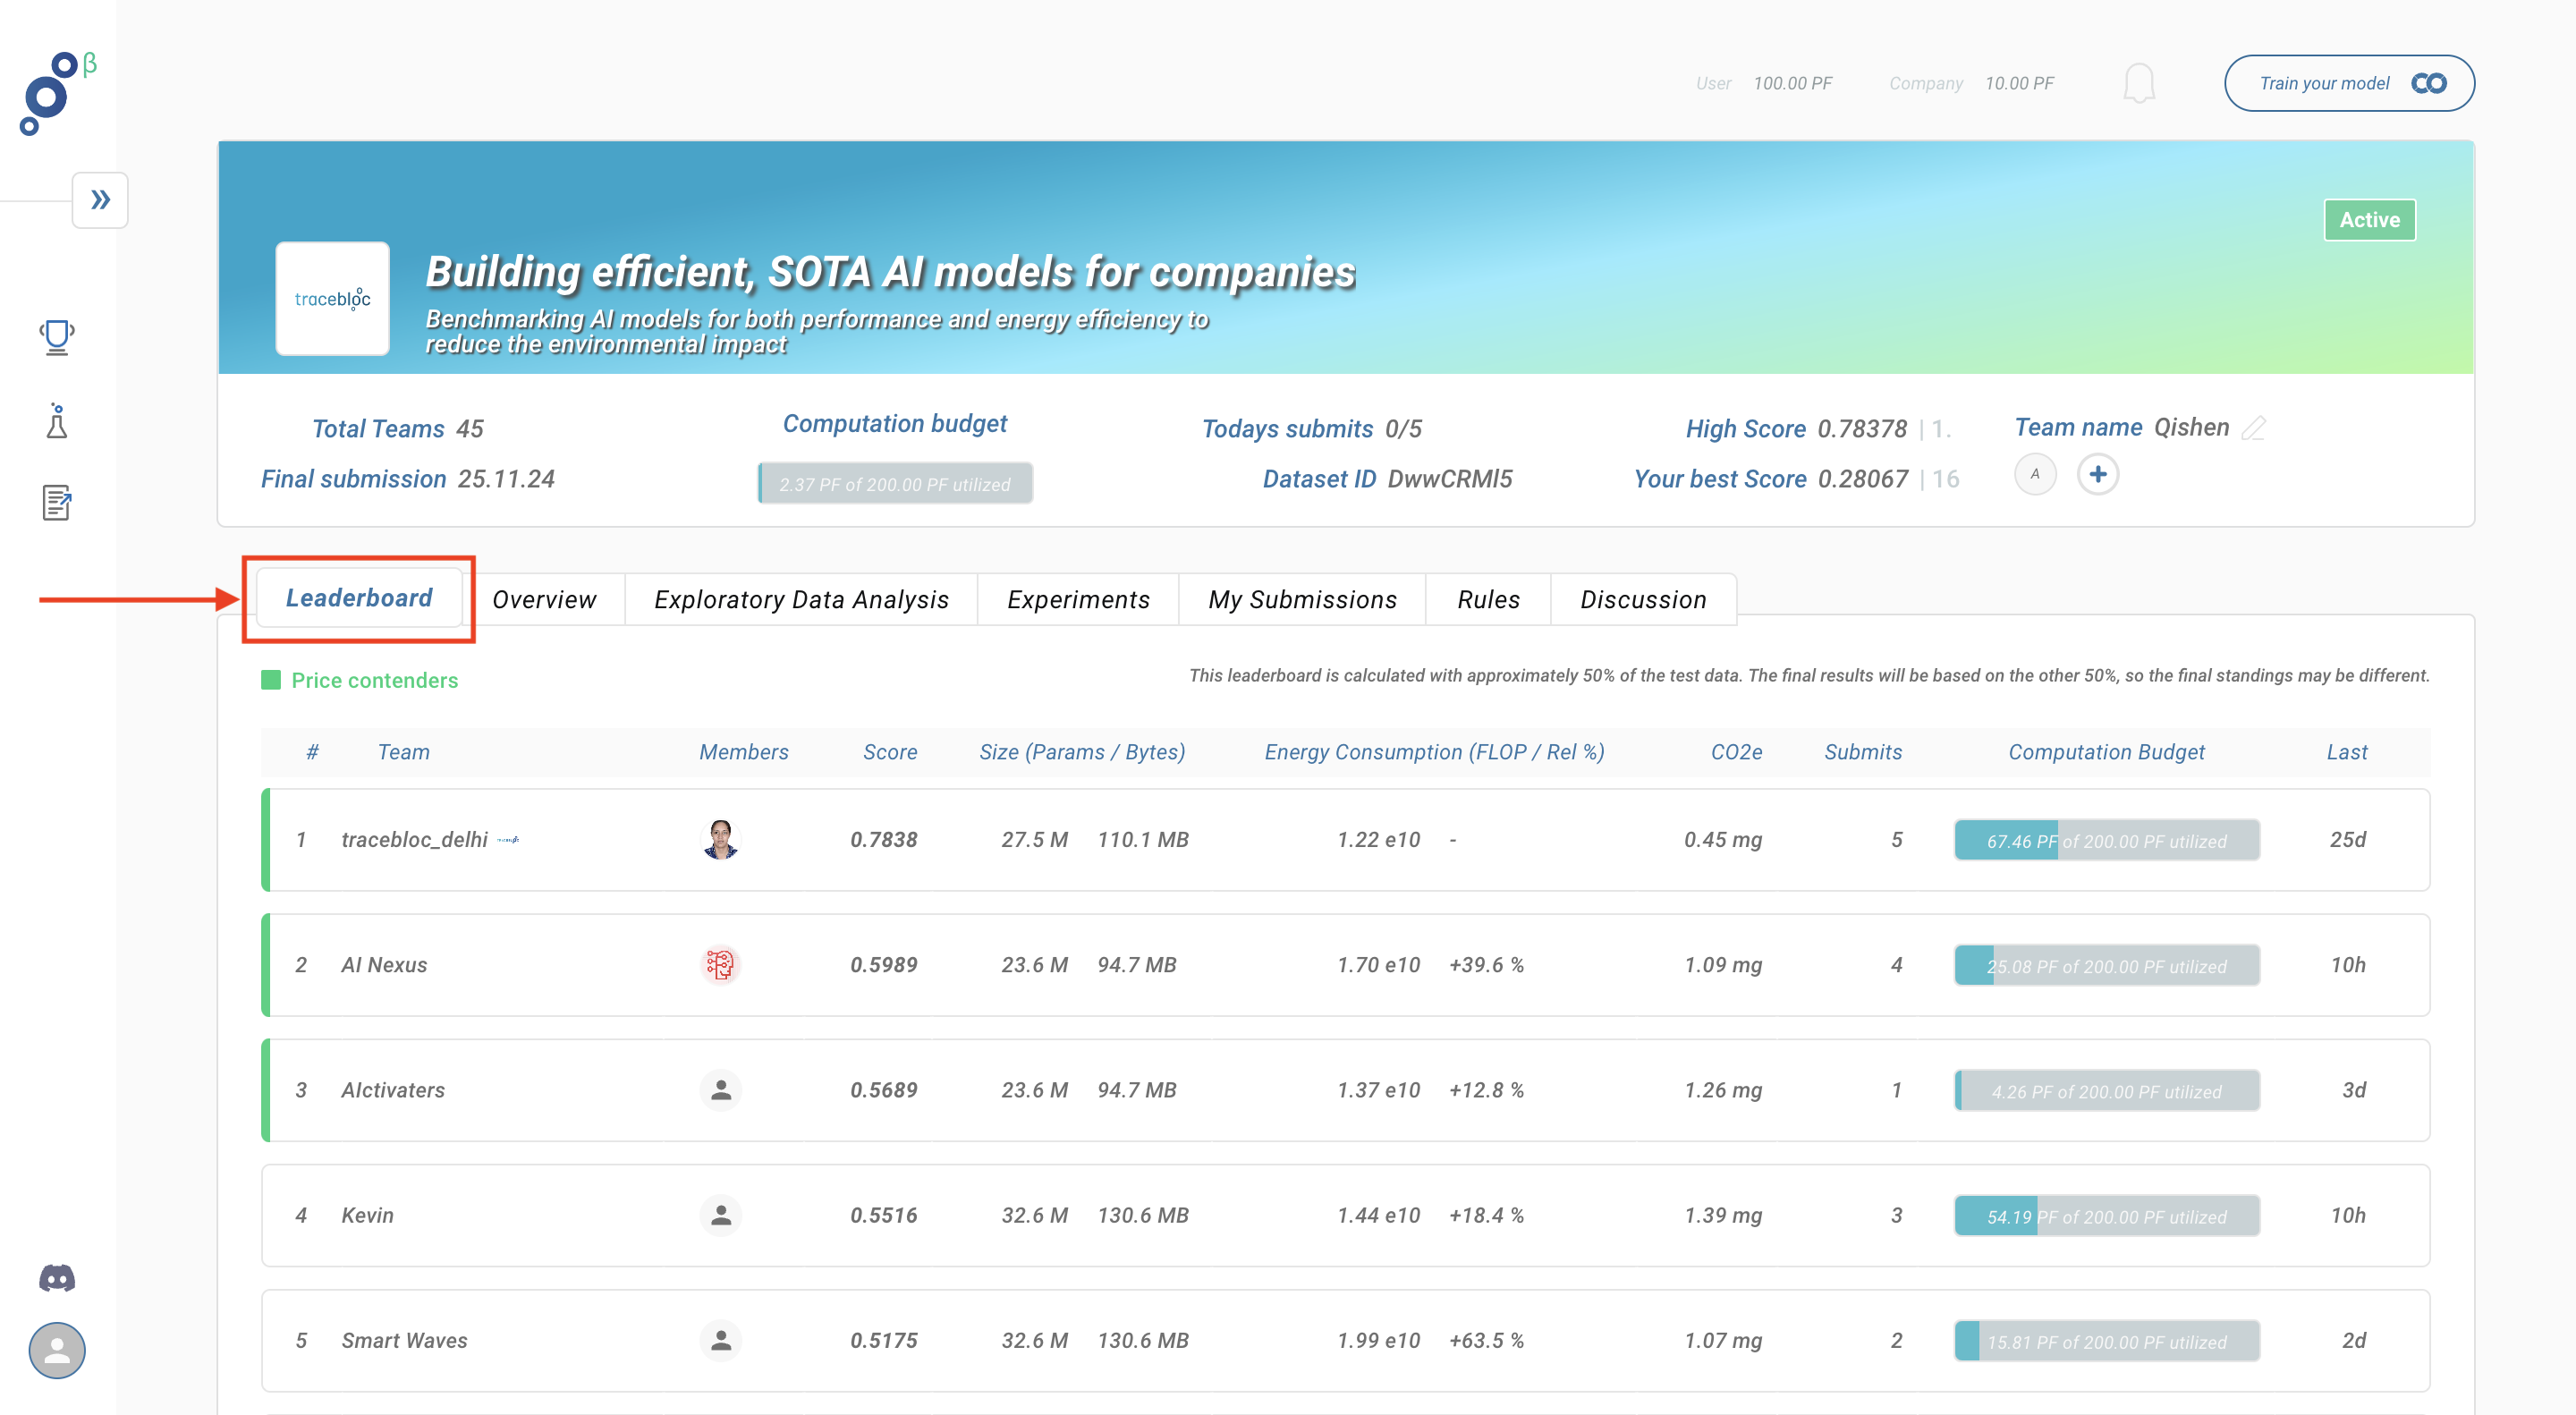
Leaderboard
You can see your models performance on the collaboration leaderboard after submitting an experiment. The performance of the model you submitted is evaluated using the collaboration metric. Along with performance one can also view other values in leaderboard:
- size of the model in "Size (Params / Bytes)" tab
- Energy consumption absolute and relative to other users in "Energy Consumption (FLOP / Rel %)" tab
- gco2 consumption in "gCo2" tab
To have a look at the leaderboard, click on the "Leaderboard" Tab in the collaboration.

On the Leaderboard you can see the performance of the other teams that submitted experiments to the collaboration. The top-performing teams that are prize contenders are marked green . The scores you can see here (refered to as "Running Score") are just based on a certain part of the test dataset, thus final scores may differ.